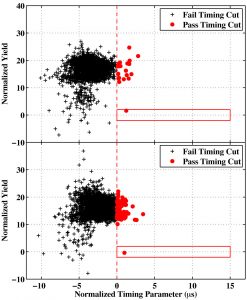
In these figures, the dotted red line divides events into those determined not to be WIMPs based on the relative timing of the heat to charge signals (left side) and those that could potentially be WIMPs based on that parameter (right side). The solid red box delineates the area of the graph in which WIMPs should occur based on both timing and the heat to charge ratio. Two events in separate detectors demonstrated the characteristics scientists predicted a WIMP would have. Credit: CDMS

