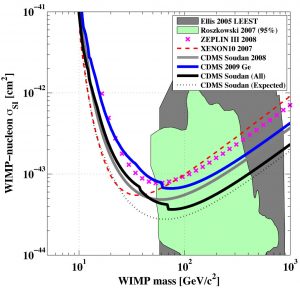
The curves dipping through this figure represent the results of several dark matter search experiments. The vertical scale represents the rate of WIMP scatters with nuclei while the horizontal scale is the mass of the WIMP. The gray line represents the 2008 results from the CDMS experiment. The blue line represents the most recent CDMS results. The solid black line represents the two results combined. The dotted black line represents the curve the combined results would have formed if CDMS had found no candidate events in 2009. The green and gray backgrounds represent areas that two theories of supersymmetry predict would contain dark matter. Credit: CDMS

