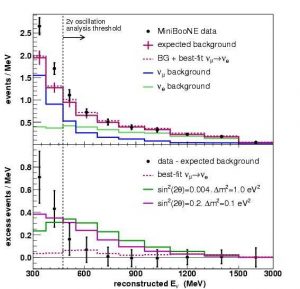
The top plot shows the raw number of electron neutrino events recorded by the MiniBooNE experiment (black dots). The bottom plot shows the number of excess events observed after subtracting the background. The solid curves in the bottom plot show two examples (green and purple curves) of predictions made for electron neutrino excess according to the two-neutrino oscillation interpretation of the LSND results. The MiniBooNE data rule out such two-neutrino oscillation predictions.

