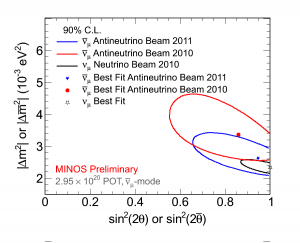
This graph demonstrates that the new MINOS antineutrino result (blue) is more precise than last year’s result (red), as reflected by the smaller oval, and the new result is in better agreement with the mass range of the 2010 neutrino result (black), reflected by the overlap of the blue and red ovals. The ovals represent the 90 percent statistical confidence levels for each result. A 90 percent confidence level means that if scientists were to repeat the measurement many times, they would expect to obtain a result that lies within the contour 90 percent of the time. The points inside the ovals show the best, or most likely, value for each of the three measurements. The best value for the 2011 measurement of the squared mass difference for the antineutrinos is 2.62 x 10⁻³ eV2.

