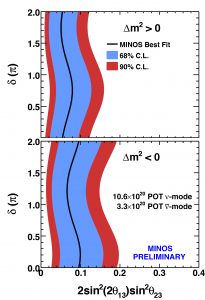
The blue and red regions in both plots show the areas allowed by MINOS for the parameters of electron-neutrino appearance. The top plot shows the MINOS measurement for one ordering of neutrino masses; the bottom plot shows the same measurement assuming the other mass ordering. The vertical axis shows allowed values of an unknown parameter that controls how much neutrinos and antineutrinos show different behavior in this process.

