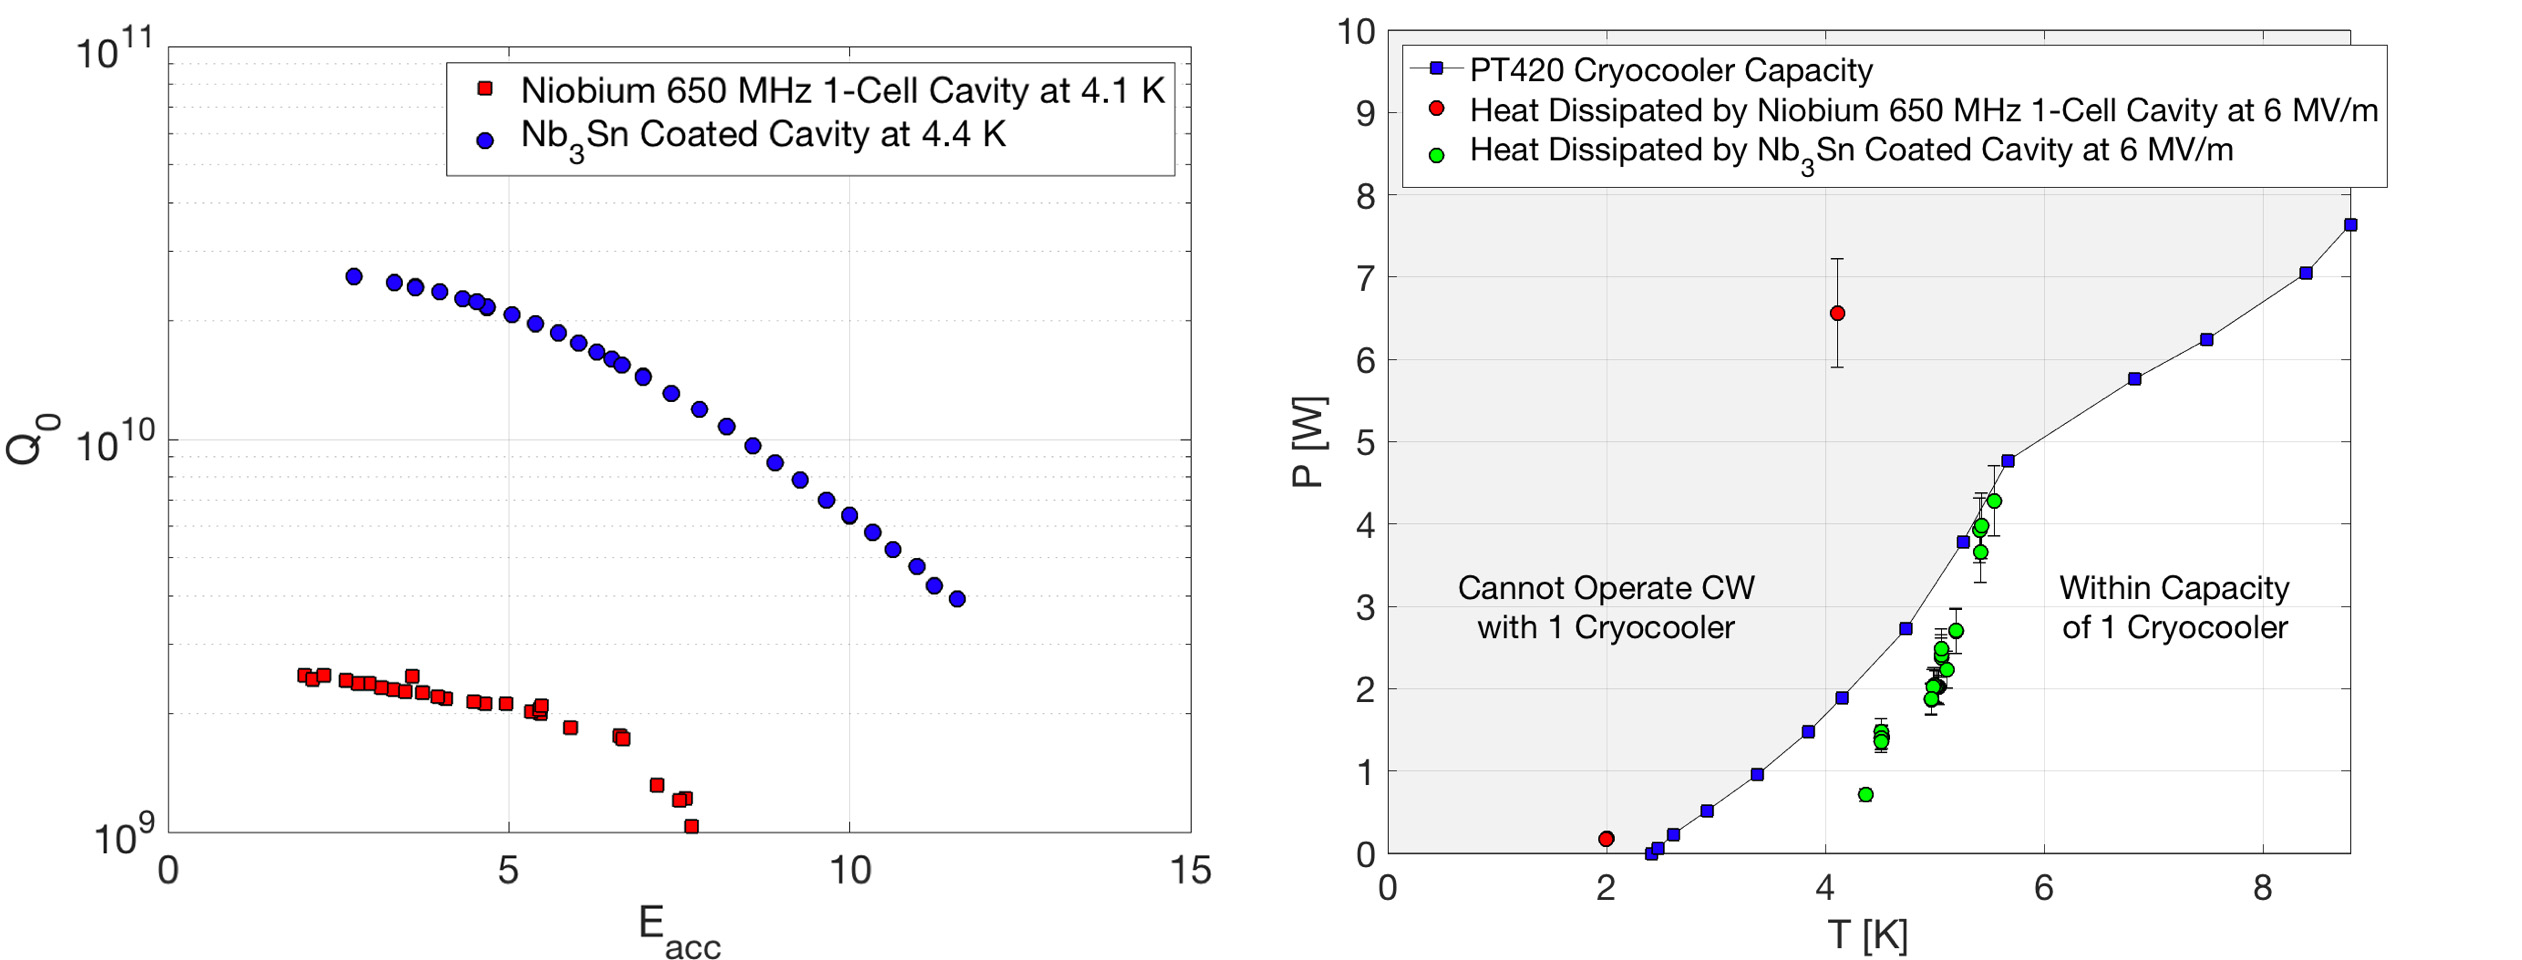
The plot on the left compares the 650-MHz cavity’s 4-5 K performance before (red) and after (blue) coating with niobium-tin. The plot on the right shows the heat dissipation compared to cryocooler capacity as a function of temperature.
The plot on the left compares the 650-MHz cavity’s 4-5 K performance before (red) and after (blue) coating with niobium-tin. The plot on the right shows the heat dissipation compared to cryocooler capacity as a function of temperature.