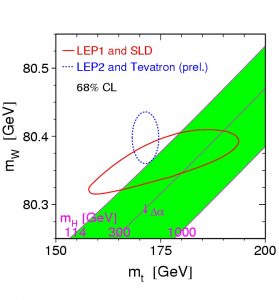
In the Standard Model of particles and forces, the masses of the W boson, the top quark and the Higgs boson are connected. If one knows the mass of any two of the three particles, then the mass of the third particle can be calculated. This plot illustrates that relationship. It depicts the mass of the Higgs boson as a function of top quark and W-boson mass. Each diagonal line represents a single Higgs boson mass; examples chosen are MH = 114, 300 and 1000 GeV/c2. Based on theoretical constraints and direct experimental searches, scientists expect the mass of the Higgs boson to lie somewhere in the green-banded region. The new CDF measurement of the W-boson mass (see this press release) indicates that the W-boson mass is heavier than previously measured (worldwide average). Since the top quark mass did not change, a heavier W-boson mass indicates a lighter Higgs Boson. The blue ellipse shows the most likely values for the top quark and W-boson masses, based on all available experimental information, including the CDF result, at the 68 percent confidence level. The intersection of this ellipse with the green band indicates the most likely Higgs boson mass. This result can be compared to an older result (red ellipse), which did little to constrain the Higgs boson mass.

