The next two years are pivotal for the Deep Underground Neutrino Experiment, the international particle physics experiment hosted by the U.S. Department of Energy’s Fermi National Accelerator Laboratory.
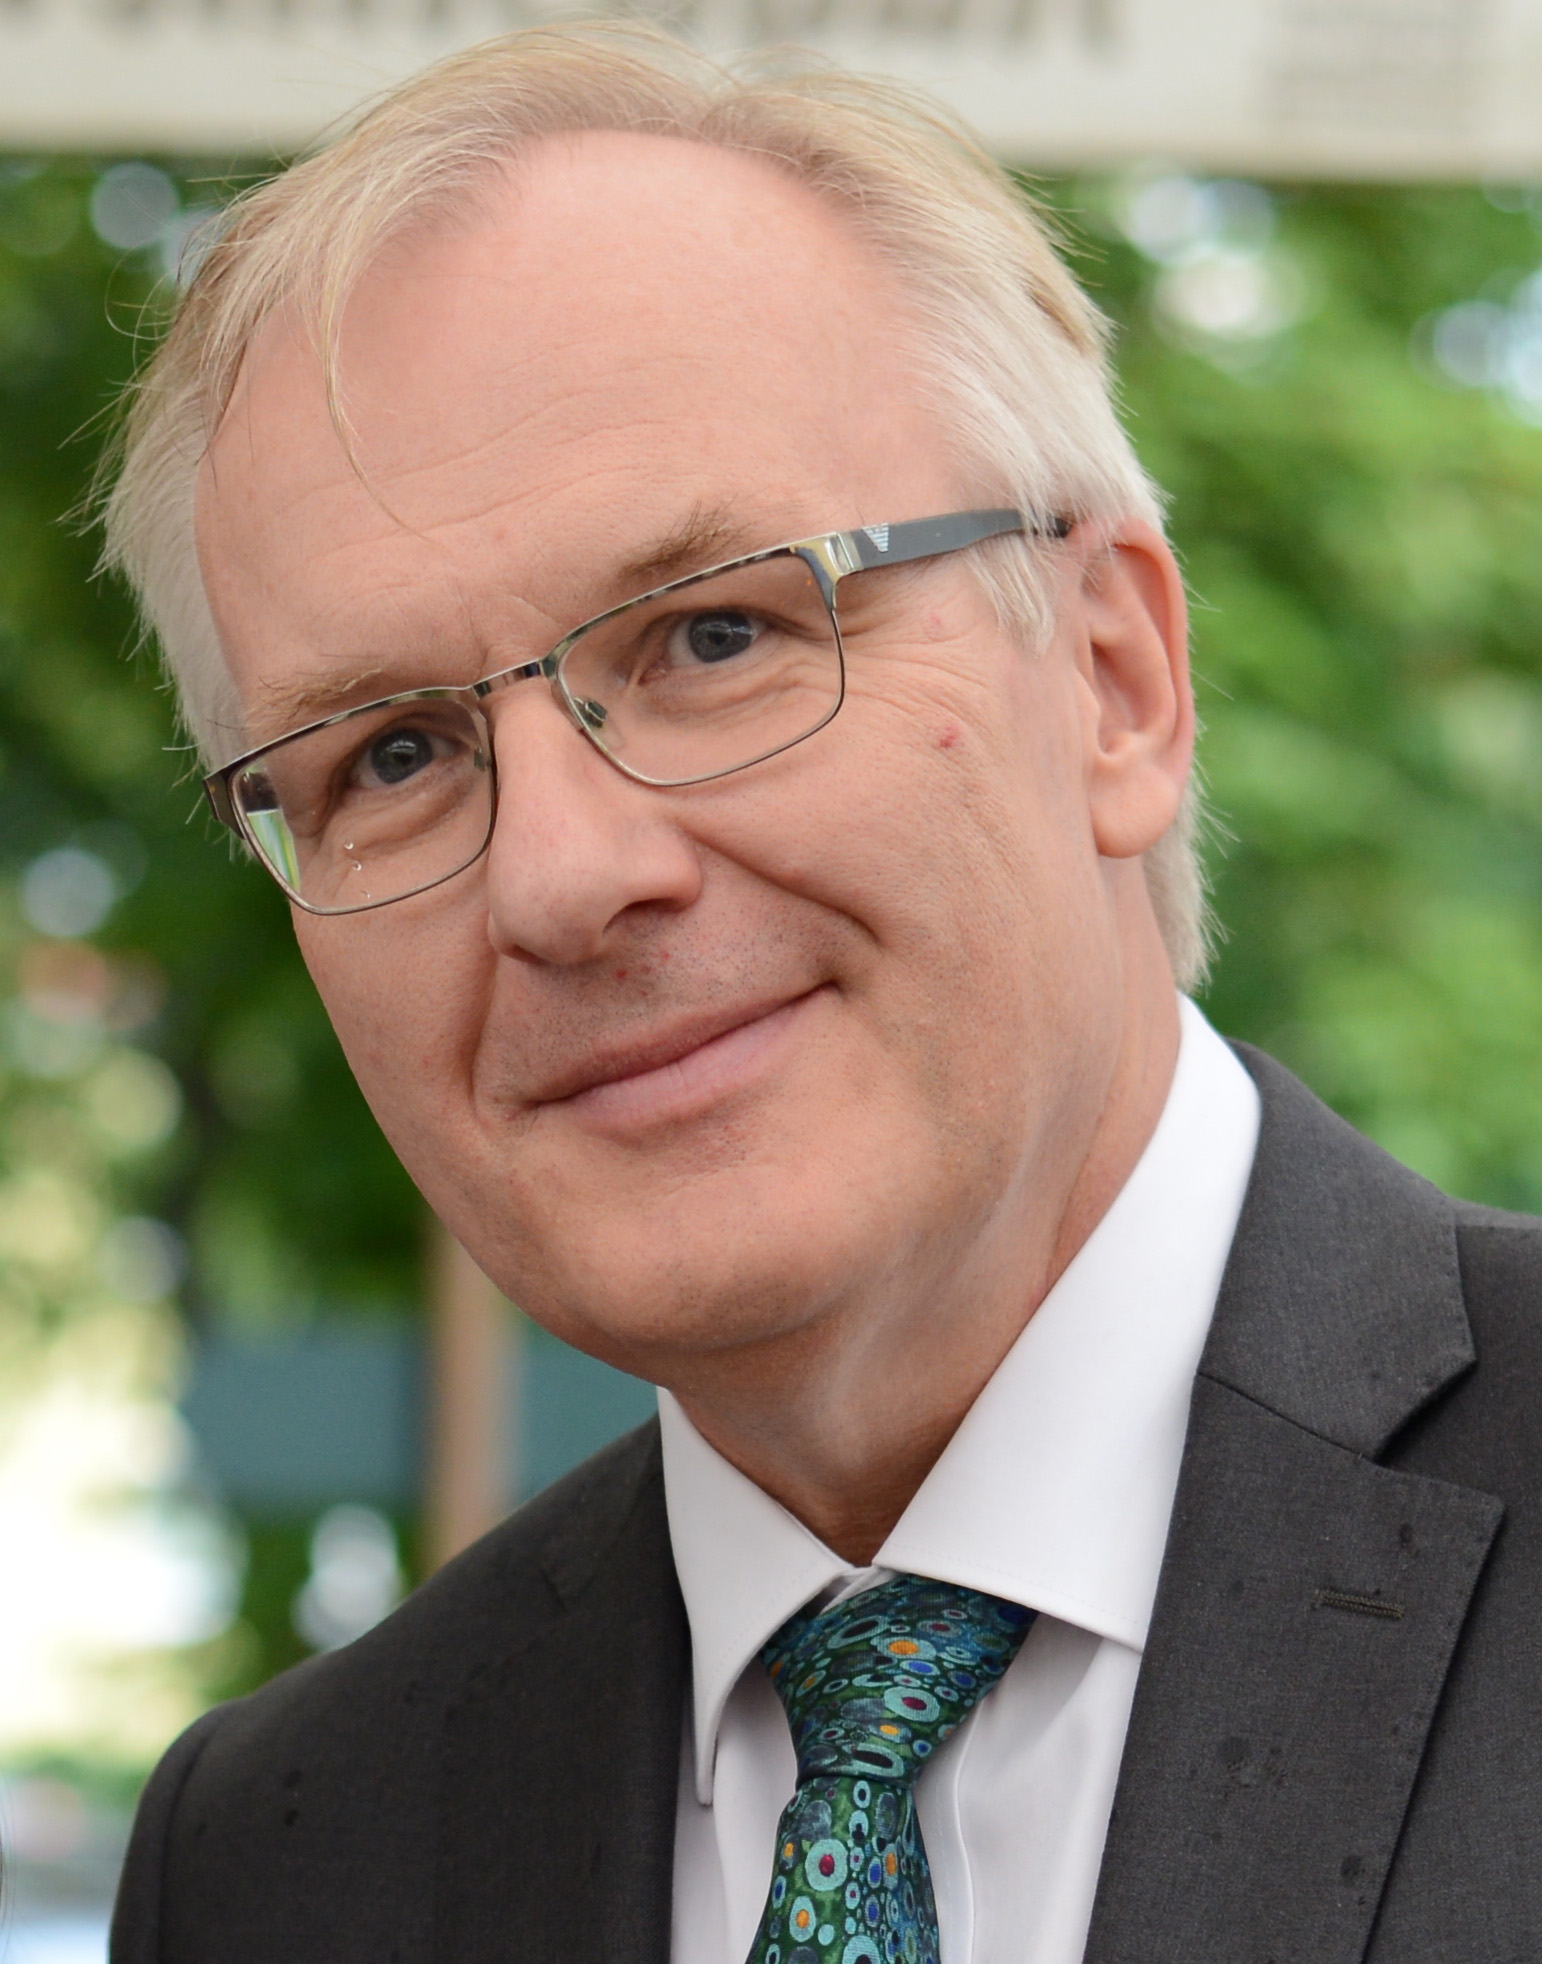
In a vote earlier this month, the DUNE collaboration elected Stefan Soldner-Rembold, professor of particle physics at the University of Manchester, as its new co-spokesperson to help guide the experiment through these next two years. Soldner-Rembold has experience leading a large collaboration – he was co-spokesperson of the 500-member DZero experiment at Fermilab from 2009 to 2011 – and has been working in neutrino physics for more than a decade.
Soldner-Rembold has served in several leadership positions within the DUNE collaboration, including chair of the Speakers Committee, and was elected as a member of the DUNE Executive Committee in 2016.
Two prototype detectors for DUNE are scheduled to be completed at CERN in Switzerland later this year, and technical design on the experiment’s full-size detector will be worked out over the next 18 months. The DUNE collaboration continues to grow – it currently includes more than 1,000 members from 31 countries – and continues to attract young minds from around the world, eager to contribute to this global-scale neutrino experiment.
“This is a formative period for DUNE,” Soldner-Rembold said. “What we decide now will shape the detectors and the way the collaboration works for the next 10 to 20 years. I’m thrilled to be stepping in as co-spokesperson during such an exciting time.”
It’s also a time in which the UK’s contributions to DUNE are ramping up. The UK has committed $88 million to the construction of the experiment (including the facility that will house it and the accelerator upgrades that will power it), and Soldner-Rembold is currently leading the UK-U.S. consortium designing and constructing vital components of the DUNE detector. Prototypes of these components are currently being installed in the ProtoDUNE detectors under construction at CERN, another major partner in DUNE.
“To build the world’s best neutrino detector, we need to attract further international partners,” Soldner-Rembold said. “The election of an international co-spokesperson sends a signal to other countries that this is an interesting and exciting project that they should join and commit to.”
Over the next few years, Soldner-Rembold said, it will be important to continue to encourage young scientists to participate in DUNE.
“In order to create a vibrant and strong collaboration, we need to encourage the next generation of young physicists to be engaged with the project,” he said.
Soldner-Rembold will take over the position from Mark Thomson of the University of Cambridge and will join Edward Blucher of the University of Chicago as co-spokesperson.
“I look forward to working closely with Stefan,” Blucher said. “His wealth of experience will prove invaluable as the DUNE collaboration navigates the exciting years ahead.”

The first particle accelerator to be built in the United States with significant contributions from international partners is taking shape at the Department of Energy’s Fermi National Accelerator Laboratory—and it has a new leader at the helm.
On March 1, Lia Merminga, an internationally renowned accelerator physicist with leadership experience at three science laboratories, took on the role of project director for the Proton Improvement Plan II.
PIP-II is Fermilab’s project to provide powerful, high-intensity proton beams to its experiments, including the flagship Long-Baseline Neutrino Facility and Deep Underground Neutrino Experiment. LBNF/DUNE brings together more than 1,000 scientists from 31 countries in the quest to unlock the mysteries of neutrinos, answering questions about why matter exists, how nature’s four forces could unify and how black holes are formed. Once complete, DUNE will be the biggest international science project ever hosted in the United States, and PIP-II will provide it with the most powerful high-energy neutrino beam in the world.
Merminga succeeds Fermilab physicist Stephen Holmes, who will retire later this year.
“I’m excited to join Fermilab and to work with the PIP-II team,” Merminga said. “Steve has done an outstanding job laying the foundation for PIP-II over the last few years, and Fermilab has an excellent reputation in developing and implementing advances in accelerator technology. I look forward to continuing Steve’s good work in upgrading our accelerator complex for the next generation of experiments.”
Merminga has more than 25 years of experience in accelerator construction and superconducting radio-frequency, or SRF, accelerator technology, the technology of choice for many current and future particle accelerators. The heart of PIP-II will be a new 800 million-electronvolt superconducting linear accelerator, which capitalizes on Fermilab’s expertise in SRF technology. It will replace the laboratory’s current linear accelerator, ramping up beam energies to double that of its predecessor.
The opportunity to partner in this cutting-edge accelerator project has attracted the interest of countries around the world, including France, India, Italy and the UK.
“Developing these technological innovations along with our partner institutions is key to PIP-II’s success,” Merminga said.
The PIP-II group works closely with the team building Fermilab’s LBNF, which provides the infrastructure to support DUNE.
“Lia’s work with accelerator construction and SRF is highly respected, and she brings a wealth of experience to Fermilab,” said Fermilab Director Nigel Lockyer. “We are pleased that she is joining us to lead the PIP-II project, which will allow powerful, high-intensity proton beams for Fermilab’s accelerator-based neutrino experiments.”
Merminga was most recently associate laboratory director for accelerators at DOE’s SLAC National Accelerator Laboratory and a professor at Stanford University. Previous positions include serving as director of the Center for Advanced Studies of Accelerators at DOE’s Thomas Jefferson National Accelerator Facility in Virginia and head of the Accelerator Division at Canada’s TRIUMF laboratory.
She has served as the chair of the Fermilab Accelerator Advisory Committee. She also served on the influential P5 Panel, which created the U.S. roadmap for particle physics, as well as on other numerous international advisory committees. Merminga has been a chair of the American Physical Society Division of Physics of Beams and is a fellow of the American Physical Society.
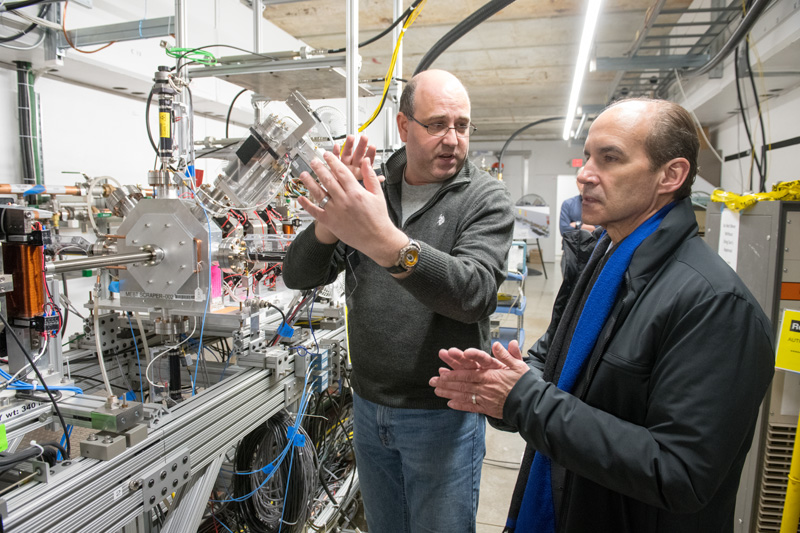
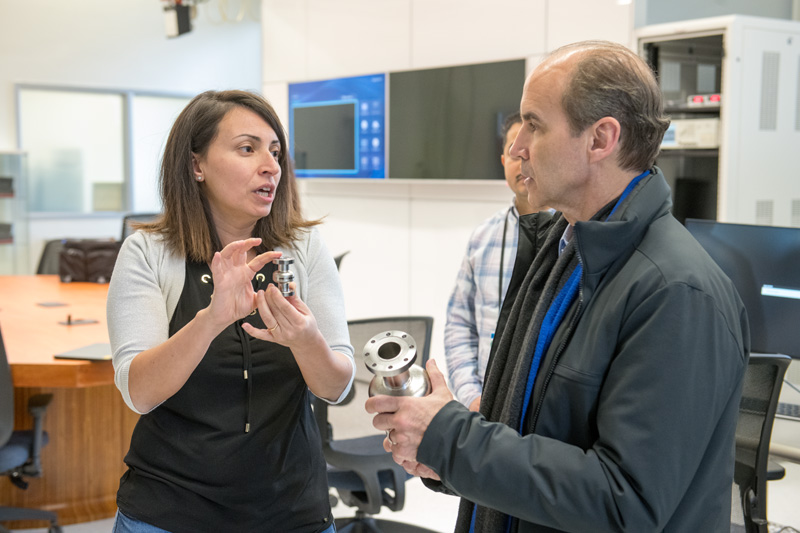
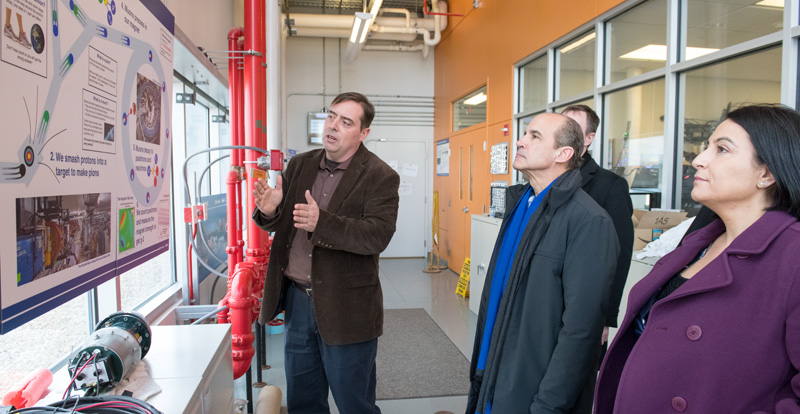
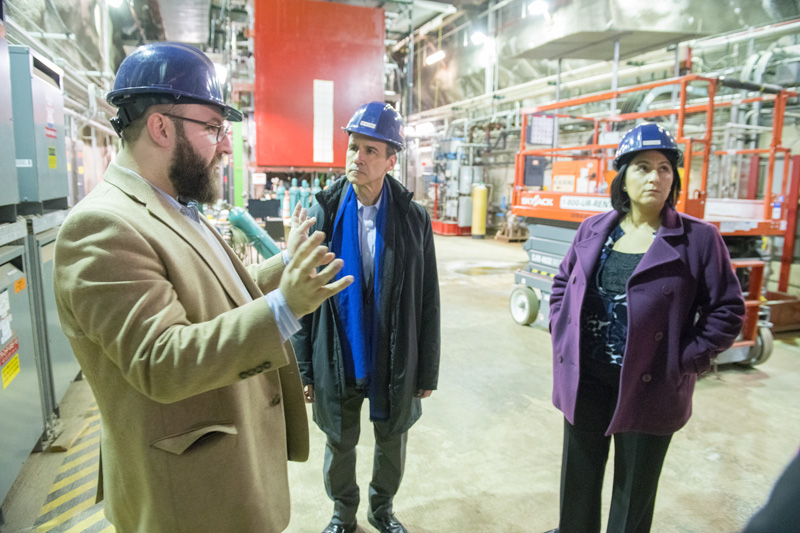
On March 8, Fermilab hosted Department of Energy Undersecretary for Energy Mark Menezes, the department’s principal advisor on energy policy and emerging energy technologies. He is also responsible for the coordinated management of DOE energy programs. Menezes previously served as an executive with Berkshire Hathaway Energy, a partner at Hunton & Williams LLP, and Chief Counsel on Energy and Environment for the U.S. House of Representatives Committee on Energy and Commerce.
During his visit, Menezes met with the Fermilab management team, members of the DOE Fermi Site Office, and about 20 scientists, among them seven recipients of DOE Early Career Research Awards. Discussion delved into Fermilab’s mission and projects, including international science endeavors such as the Fermilab-hosted LBNF/DUNE project and CERN-hosted Large Hadron Collider, the technology that powers energetic particle beams, and partnerships with industry and other agencies.

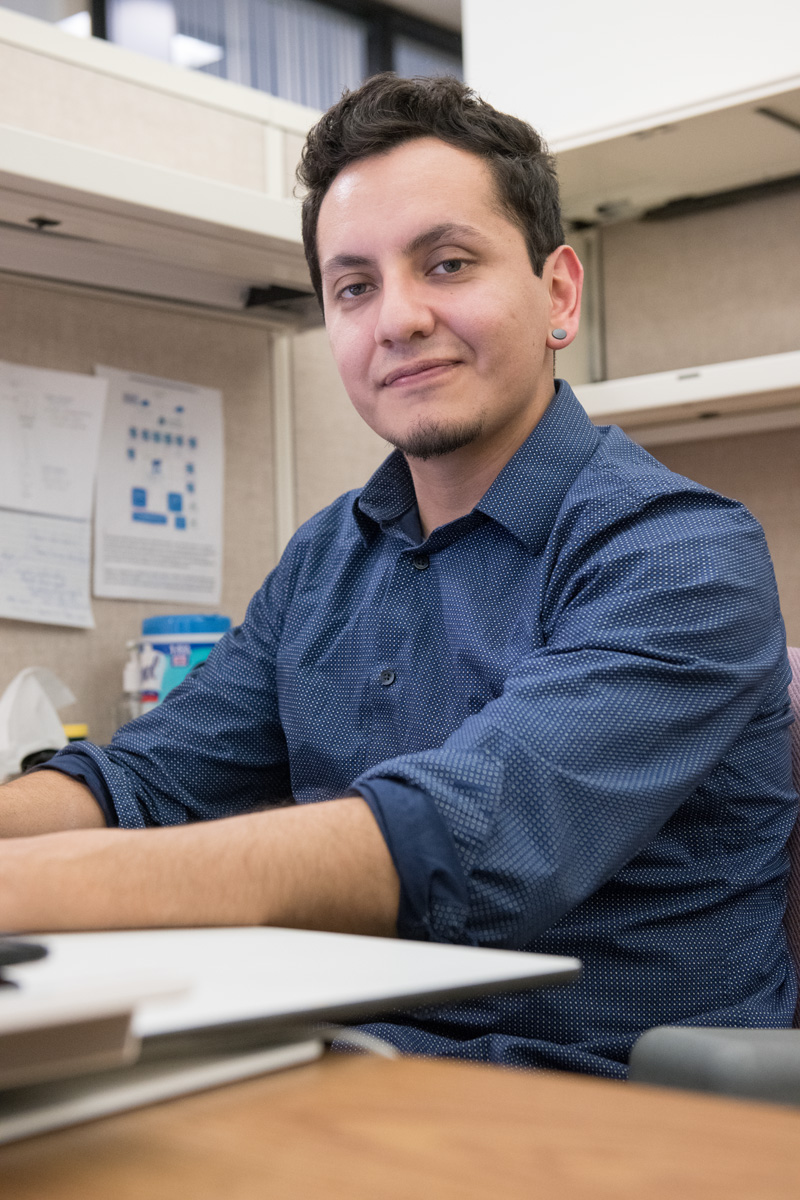
When he isn’t developing software develop for Fermilab, Felix Sotres is active in STEM outreach. Photo: Reidar Hahn
How long have you been at Fermilab?
A year and a half. It seems to me you’re still a new guy if you’ve been here for 10 years.
What is your role at Fermilab?
I’m a ServiceNow developer. ServiceNow is a software platform that a lot of different sections of the lab use. If something is broken, I’ll fix it, or if there are custom applications that need to be made, then I either create, modify or fix them.
I’m also one of the developers for mobile devices at Fermilab. If you go to the Apple or Google Play store and download the Fermilab app — I wrote that, building on previous work.
What initially piqued your interest in programming?
I never really knew what I wanted to do. I used to play this computer game. And I started just creating my own little maps for the game. Eventually I found out I was programming, and I really liked it. So then I thought, “Is there a field in this? Could I make a career out of this?” And it turns out that there is, so that’s how I got my start.
What I like best is the problem-solving and those kind of “a-ha” moments where you finally get something done.
What do you like most about your job here?
What I love about it is putting my little grain in the advancement of science. I really believe in the lab and what it does, and I feel like I’m part of it. It’s the sense of being a part of it and having pride.
What project are you currently working on?
Currently, there’s a lot of automation and business processes that happen when you submit a ServiceNow ticket, or a request, or when something’s broken. So for the automation on the back end, I’m working on a project that will dynamically handle 80 percent of things, and it’s data-driven. It’s one automation to rule them all. I’m working with my senior developers and the data architect on this.
What else are you involved in at Fermilab?
I work with the Lederman Science Education Center, and I’ve been able to do some presentations at different schools in the area. At the first one, we went to my old library in Crystal Lake. I used to go to that library after school and do my homework, and this time I got to give a presentation to the kids there. It was on electricity and magnetism, so we had demos, and I showed them some videos. It was really cool because the kids were very interested, and I had quite a few of them rush up to me at the end and ask me, “What is that?” and “What else can you show us?”
Just recently I got involved in the Society of Hispanic Professional Engineers. I’m the VP of professional development, and we just founded the professional chapter at Fermilab.
What’s something about you that might surprise people?
I like to go sailing and scuba diving. I practiced with the UIC sailing team at the Columbia Yacht Club in Chicago. I also swam in the whale shark exhibit at the Georgia Aquarium. It’s one of two aquariums in the world that is large enough to house them.
What do you like to do when you’re not at work?
I’m on a bowling league with my friends. We won our first two times that we participated, so that was fun. And then I bought a new house. It’s an investment property, so I’m rehabbing it. I’ve never been a handy or tool kind of guy, but now I’m learning how to do stuff, and I can talk shop with other handy folks.
 Small businesses invited to join Fermilab to discuss partnership opportunities on March 14

Editor’s note: The registration deadline for the event has been extended to March 9.
Registration is now open for Fermilab’s 2018 Small Business Fair, to be held on March 14. Representatives from local small businesses are invited to discuss opportunities to strengthen relationships between the lab and the local business community.
The half-day session (8 a.m. to noon) will be hosted at the U.S. Department of Energy’s Fermi National Accelerator Laboratory in Batavia, Illinois. Local businesses will be made aware of opportunities to bid for subcontracts for work on Fermilab projects and will be connected to key people at the lab who can guide them through those opportunities.
“Our success at this event would mean awarding future subcontracts to small businesses from connections made at the fair,” said Jane Graves, procurement administrator and event chair.
In the long term, she said, Fermilab aims to increase access to opportunities with the private sector, especially local and small businesses.
Fermilab generates millions in economic output for the state of Illinois each year and supports thousands of jobs. Projects such as the Illinois Accelerator Research Center create partnership and job opportunities across the state and will create more as an incubator for technology companies.
In addition, attendees will be able to learn more about how they can access Fermilab’s unique technologies, capabilities and facilities to create potentially game-changing innovations. Through Fermilab’s Partnerships and Technology Transfer program, industry partners are able to license Fermilab patented and copyrighted technologies; use unique facilities and technical services through Strategic Partnership Projects (SPP) agreements; or participate in joint research through a Cooperative Research and Development Agreement (CRADA).
Fermilab’s long history of making its technology available started in 1946, when its first director, Robert Wilson, proposed using particle accelerators to treat cancer. This was made a reality when, in 1990, Fermilab installed the first proton therapy accelerator in the United States at the Loma Linda University Medical Center in California.
Fermilab leaders hope to strengthen relationships with local and businesses, ensuring that local companies can benefit from the infrastructure and technology created for the laboratory’s research.
Registration is open until March 9. Please visit http://events.fnal.gov/smallbusiness to apply, and contact Jane Graves at 630-840-4194 or jgraves@fnal.gov with questions about registration.
Fermilab is America’s premier national laboratory for particle physics and accelerator research. A U.S. Department of Energy Office of Science laboratory, Fermilab is located near Chicago, Illinois, and operated under contract by the Fermi Research Alliance LLC, a joint partnership between the University of Chicago and the Universities Research Association Inc. Visit Fermilab’s website at www.fnal.gov and follow us on Twitter at @Fermilab.
The DOE Office of Science is the single largest supporter of basic research in the physical sciences in the United States, and is working to address some of the most pressing challenges of our time. For more information, please visit http://science.energy.gov.